ELECTROCARDIOGRAPHY
FOR DUMMIES:
A
simpleton's guide to how they work and what they tell us.
Introduction:
When I developed an irregular heart beat that would appear for an hour then go away for weeks before reappearing, I decided to purchase a small, hand held EKG (electrocardiogram) monitor to record one of the events so that the next time I saw my doctor I could show him what was going on. I had already seen another doctor about the issue and was told that it was non-life-threatening and that its extremely erratic appearance made it impractical to wear a professional monitor long enough to capture one of the events. The monitor I got was an Observer Model MD100B ECG Monitor. It cost $178.
Being an inquisitive sort, I naturally wondered how EKG (or ECG) monitors worked and what the traces they produce represented. This page presents what I learned so that anyone similarly interested in EKGs can learn the basics of their operation without having to purchase one for themselves. It's intended to provide only the basics and employs many generalizations and over simplifications to make it easy for anyone to understand, including extreme medical lay-persons like myself. Before I go any further I need to make the following statement:
Important
Disclaimer: I am not a doctor and have had no medical training.
Nothing
stated on this page should be taken as a recommendation.
This
page is only for basic information and entertainment.
Only
qualified medical professionals can administer
and
evaluate electrocardiographs.
An electrocardiogram is a device that measures electrical signals from the heart through skim-mounted electrodes and produces charts (electrocardiographs) of these signals that represent the heart's function. Originally developed by Dr. William Einthoven in 1901, the principle letters of his original name for it ElectroKardioGram form the acronym EKG, which is still in use to this day even though the spelling has been Anglicized to electrocardiogram. For this article an electrocardiogram will refer to the machine and an electrocardiograph to the paper record the electrocardiogram produces.
As
to how it works... we have to deal with a little physics.
The
Physics of Electrocardiography:
Everything is composed of atoms, which are made up of a cluster of positively charged particles in the central nucleus surrounded by a cloud of an equal number of negative electrons. Removing an electron from an atom results in the atom having a net positive charge. This is called ionization and the charged atom is called an ion. For example: strip an electron off a sodium atom (symbol Na) and you end up with a sodium ion (symbol Na+). Do the same thing to a potassium atom and you have a potassium ion (K+).
Creating ions sounds like something you'd need an atom smasher to accomplish. Actually, all it takes is a balloon and a piece of polyester fabric. Rubbing the balloon with the cloth removes electrons from it giving the balloon a net positive charge. In a sense the balloon becomes a giant ion. This ionic charge is what makes it possible to get the balloon to stick to a wall. The charge trapped on the balloon gives off an electric field that holds it to the wall.
Imagine that you place one of these positively charged balloon between two flat metal plates connected through wires to a very sensitive meter. If you move the balloon toward one of the electrodes the balloon's electric field will cause a small current to flow through the wires deflecting the meter's needle. Move it the opposite direction and the meter with swing in the opposite direction.
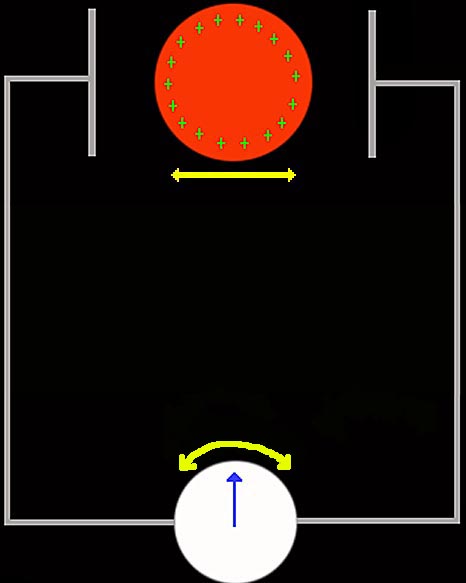
Tape a pen to the needle and rest the pen on a strip of moving paper and as the balloon moves, the needle will match its movement. The pen will slide back and forth across the paper making a permanent record of the balloon's motion.
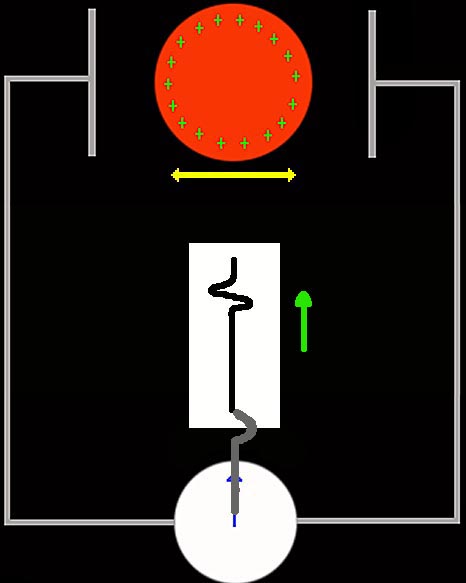
Once we know which way the needle moves in relation to which way the balloon moves we can use the paper record, which we could call an electroballoonograph, to tell us how the balloon is moving... even if we can't see the balloon. Consider the following image where the balloon is hidden behind a sheet of paper:
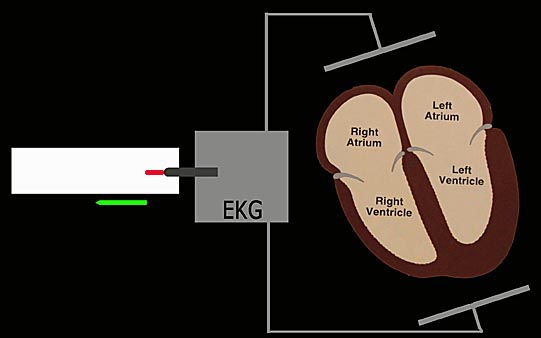
If we assume that moving the balloon to the left causes the needle to move to the left, then the electroballoonograph above tells us the balloon was moved twice to the left. The great feature of this device is that we can tell from the graph the direction and magnitude of the balloon's movements without having to see or touch it. Replace the balloon with a human heart and the plates with electrodes taped to a patient's skin and you have an electrocardiogram.
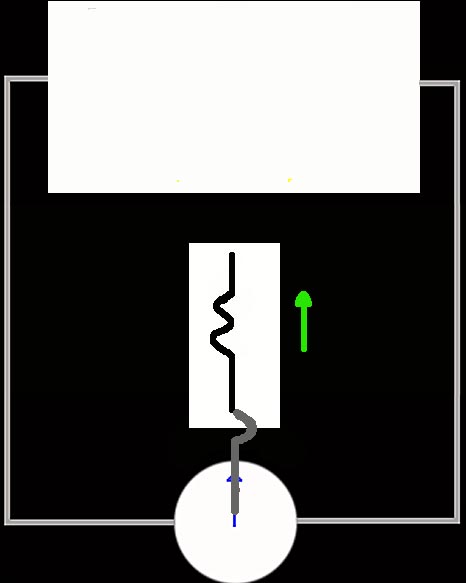
In the image above, we've started the paper moving to the left while the heart is still. If we placed the positively charged balloon where the heart is and moved the balloon down toward the lower electrode the pen would deflect upward.
Time to start our heart beating...
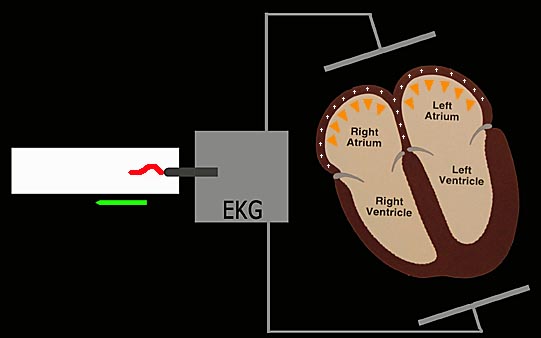
A human heart consists of four chambers that beat (contract) in pairs: the two atriums at the top and the larger ventricles below them. The right chambers pump blood from the body into the lungs and the left chambers pump it from the lungs to the body. The two atriums contract together as do the two ventricles.
A "beat" starts by the heart's pacemaker, a cluster of cells called the SA Node in the top of the right atrium, sending an expanding wave of Na+ ions into the muscle tissues of the atriums causing them to contract, pushing downward and forcing blood into the ventricles. This flood of Na+ ions not only moves on its own but is physically carried downward by the downward movement of the atrium's walls as the contract. Just as with the balloon, this downward moving mass of charge is sensed by the electrodes, which results in the electrocardiogram's needle being deflected upward and recording a bump on the paper.
Because the field associated with the movement of the charges is weak, the movement small, electrically slow compared to high power generators and shielded from the electrodes by flesh and distance, it is extremely small, on the orders of a few millionths of a volt. This means the bulk of an EKG is devoted to high gain amplifiers that can boost this weak signal until it's large enough to move the pen. Even more electronics is dedicated to eliminating the noise the electrodes pick up from everything from the electric clock by the patient's bed to the buzz of the cell phone he forgot to turn off.
But back to our beating heart...
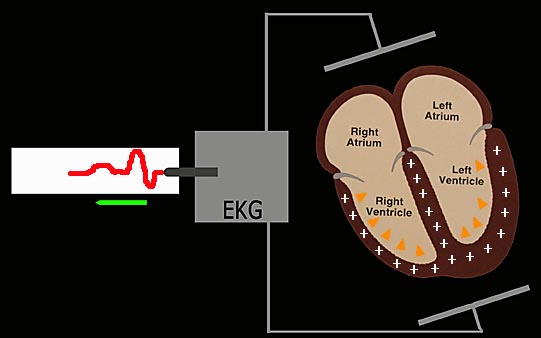
After a short pause to allow blood to pass from the atriums into the ventricles, the same flood of Na+ ions that triggered the atriums to contract does the same thing for the ventricles. The problem is that unlike the atriums, part of the ventricle contraction physically moves the Na+ ions away from the lower electrode because as they contract the ventricle walls move upward. The actual movement of ions and ventricle walls is very complicated and results in the net movement of ions at first toward then away from the lower electrode, as shown by the upward and downward trace on the electrocardiograph below:
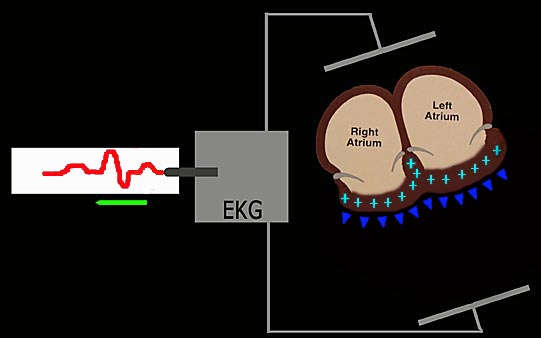
The last event is that the contracted ventricles relax and move back down, ready to receive the next load of blood to be pumped to the lungs and body. This is triggered by a flood of K+ ions, which move toward the lower electrode creating a final upward bump on the electrocardiograph.
Once the ventricles are back in place, the cycle repeats itself sixty or so times a minute for our entires lives.
Let's take a closer look at one beat recorded by our simplified electrocardiogram:
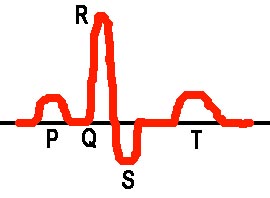
By convention, the first upward bump associated with the atrium's contraction is called the P wave. The first part of the complex ventricle contraction is the Q wave, a small downward bump that doesn't show up on most electrocardiographs, the R wave and S wave. The T wave is the ventricle's returning to their uncontracted shape. An electrocardiograph is typically a strip of paper long enough to record 30 seconds of cardiac function, or around 36 heart beats. By examining this graph a trained professional can diagnose a whole host of problems. For example: if the P wave is absent, one possibility is that the heart's main pacemaker, the SA Node, isn't doing its job. If the R or S waves are too thick it may suggest a conduction problem in the ventricles. If there are far too many heart beats it may mean one or more of the heart's back-up pacemakers are firing in addition to the SA node, a condition called tachycardia. The spacing between the waves can also be used to diagnose problems as can the shape of the waves. The list goes on and on and that it why only trained professionals should evaluate electrocardiographs. If an untrained person attempts it there is the very real possibility a serious problem could be missed or incorrectly diagnosed. Because the heart is needed for every second of life, this is too important to be handled by anyone except a professional.
Why
So Many Leads?
Because the ion movements that an electrocardiogram records are extremely complex, they need to be observed from many different viewpoints to see what's really going on. By placing many electrodes on the body they can be matched up in pairs, each one of which provides a different view of the heart's motion. In the simplified example used above, the positive ion movements are in line between the two electrodes. But, imagine that this heart's right atrium and left ventricles weren't contracting. Since the only ion movements would be in the left atrium and right ventricle, the net movement would be on an axis pointing slightly clockwise to the original axis in a more downward direction. With only one set of electrodes all you might see was a slightly reduced amplitude of the PQRST complex. But, if you had other pairs that you could switch on and off, you would be able to see that some pairs give stronger deflections than others, signalling a problem. Most EKGs have the capability to print out several electrode pair traces at the same time for easy comparison.
Hand
Held EKG Monitors:
Here's my Observer Model MD100B ECG Monitor.
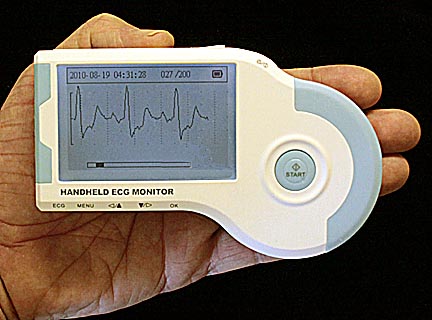
It's used by curling a finger around the curved end while holding the left flat end against the palm of the other hand and pressing the "start" button. After six seconds to initialize itself, it records 30 seconds of heart action. Up to 200 of these traces can be recorded internally. It can also be connected to a computer for continuous recording or printing saved traces. It is extremely easy to use.
You can also use it by pressing the left flat end against your chest or connecting it to sticky electrodes stuck on your chest. I found pressing it against my chest gave the best results.
What My Hand Held Monitor Told Me:
Here's an example of the irregular heart beat that I recorded.
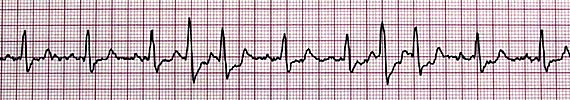
And what does this electrocardiograph tell me?
Nothing!
Only a trained professional using an actual ekg machine can diagnose heart problems. I'm not a professional and this little unit does not have the accuracy or multiple reading capability required for a diagnoses. All it can do is record that "something" is happening that is not in my imagination. At the most it provided my cardiologist a suggestion of which real tests he wanted to conduct to determine what was actually going on.
Final
Words:
I sincerely hope you enjoyed this page as much as I did putting it together. Most of the information on it came from Dr. Dale Dubin's text, Rapid Interpretation of EKGs, 6th Ed., Cover Publishing Co., Fort Myers, Florida. Copyright 2000.
![]()
Return to the main
page
for more medical topics or to browse 80 other subjects: everything
from kites and rocket engines to the weird world of lucid dreaming.