ABOUT THIS AND THAT
How this website came to be so big.
THIS AND THAT started in 1998 as a small, six-page site intended to provide public access to a Star Trek Deep Space Nine novel (Dreadnought) and three X-Files novels (Player, Mirrors, and Dreamer) I had written. I used the free 10 MB that came with my Earthlink account and wrote the site using an excellent, and sadly no longer available, software package called Webpage Construction Kit 5.0 by MacMillian. After comparing many background/font color combinations I discovered that on the monitors common back then, white letters on black backgrounds provided the clearest text. The black backgrounds also went well with the dark themes of the X-Files stories and the in-space context of the Deep Space Nine novel. While the monitor resolution problems of the 1990s are no longer an issue in these high definition days, after 22 years the black background and white text has become a hallmark of the site.
In those early days I counted myself lucky to get ten visitors a month. Little did I know that was soon to change.
While setting up a link exchange to promote Dreadnought, I noticed that there wasn't a comprehensive listing of sites with DS9 fan fiction. I decided to put one together as a service to other people interested in that fandom. Three months later I had amassed 200 links. THE DS9 FAN FICTION LINK LIST became very popular and attracted ten times as many visitors as all the other pages on the site put together. This suggested that the more pages the site had to attract people, the more people would be attracted to the site. I began adding pages about many of my hobbies. It worked.
Every time a new page went on-line the number of visitors increased. Before long the site had grown to 40 pages covering a dozen subjects. Then two things happened that catapulted the site to higher levels of popularity than I'd ever imagined.
First, I became interested in breeding and raising bettas (Siamese fighting fish.) When I added several pages on this subject the visitor count tripled overnight. The reason was that millions of people are interested in bettas and many of them use the Internet to learn more about these fish. Since there were comparatively few sites with in-depth information about them back then, This and That started showing up on search engines, resulting in many more people learning about the site.
The second event was that I purchased website promotion software titled Addweb 5.0 and used it to submit the site to thousands of search engines and link lists across the world. That was back when you could do such things. (Sigh...)
Together, the above two events resulted in the site jumping from 100 visitors a month to over 1,000. But things were about to get even better.
From 1999 to 2002 I continued to add topics to the site until it had grown to 150 pages. At that point the site had outgrown the original 10 MB of free space so I purchased a larger ".com" address. By 2003 the site had grown to 180 pages covering 70 topics. By that time the monthly visitor rate had increased to 5,000.
Then one fateful day I received an email from someone who stated he really enjoyed the site but wondered if I knew that I was discouraging many people from visiting it because I hadn't filled out the HTML header statements on the pages. Many of these pages were being listed as "untitled" by search engines and had poor descriptions. After I fixed this problem the number of people logging onto the site went into orbit. Within 11 months it had increased nine-fold to 45,000 visitors each and every month. That's over 500,000 people a year; pretty good for a non-commercial site that didn't sell anything.
In 2004 the site passed a threshold in that it was getting enough visitors that it began moving up in search engine listings. This caused more people to visit it which in turn pushed its ranking up even higher. In the following decade I continued to add more pages to the site, which continued to boost its popularity.
2013 was a big year for the site because it saw the creation a YouTube channel with videos about subjects featured on the website. People visiting the website started visiting the YouTube channel and visa versa. Although they're separate entities, the two venues help each other.
The following link will take interested visitors directly to:
...with over 493 videos.
Another innovation that has proved greatly beneficial is using the site to promote new pages. I created a link at the bottom of each page that teases visitors to click on it to view a summery of the newest page. This gives the new page an average of thousands of exposures a day. The result is that new pages get much greater view rates and linkbacks than if they had to wait and fight their way up the Google rankings ladder. Instead of months to struggle into the top 30, a page usually breaks into the top 30 within two weeks.
Here's
how the annual pageviews have increased over the years:
1998 - ......1,000
1999 - ......3,000
2000 -...... 6,000
2001 -..... 55,000
2002 -..... 70,000
2003 - ...130,000
2004 - ...416,000
2005 -... 896,585
2006 - 1,384,404
2007 - 1,541,259
2008 - 1,761,377
2009 - 2,258,060
2010 - 2,890,811
2011 - 2,506,480
2012 - 2,737,496
2013 - 2,048,822
2014 - 2,189,818
2015 - 2,478,126
2016 - 1,441,451 (I believe this precipitous decrease is the result of people abandoning traditional text-based web pages in favor of easier-to-watch and more entertaining YouTube videos.)
2017 - 1,337,247
2018
- 1,064,886 (Text
based sites continue to decrease because of YouTube and also because
70-percent of all Internet activity is now via cell phones, which do
not display text based websites in an easy to read format.)
2019 - 976,741
Giving a total of 28,194,568 visitors in 22 years.
Here are the annual video view totals:
2013 (22 videos) - ......... .928 views
2014 (49 videos) - .....111,908
2015 (160 videos) -..1,437,244
2016 (295 videos) - .2,914,172
2017 (376 videos) - .2,998,837
2018 (432 videos) - 2,768,939
2019 (493 videos) - 1,997,397
Giving a total of 12,229,425.
Combining the traditional website views with the YouTube views provides a more complete image of the site's overall popularity:
2013 - 2,049,750
2014 - 2,301,726
2015 - 3,915,370
2016 - 4,355,623
2017 - 4,336,084
2018 - 3,833,825
2019 - 2,974,138
Giving a grand total of 40,423,993 views in 22 years. The following is a graphical representation of the site's visitor rate:
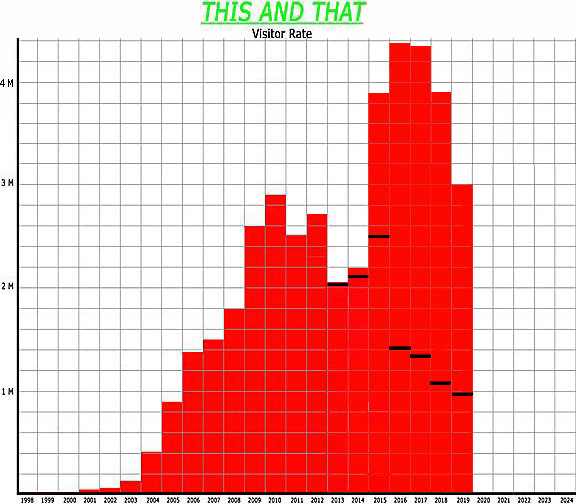
Because I believe posting a video about a subject is the same as posting a text based page, starting with 2013 I'm including the number of YouTube video views in the chart of the total number of visitors to the site. The YouTube channel is like a separate set of additional webpages and as such deserves to be included in the total. The horizontal black lines indicate the number of visitors to the original website while the red column above them shows the number of YouTube views.
The decreases from 2011 to 2013 are the result of Google changing its rankings systems in an effort to limit content farms. Unfortunately, one of the unexpected side effects of Google's new algorithym was lower rankings for content-rich, non-commercial sites like THIS AND THAT. The massive increase in YouTube views in 2015 was half the result of one of the video's going mini-viral. In 21 days it was viewed over 1,000,000 times. Without this the 2015 total would have been closer to 767,000 views and the combined website and YouTube view total would have been 3,231,709.
I believe another reason the site isn't getting as many visitors as before is that according to YouTube, 70% of all Internet activity is now done on smart phones instead of computers. Because text-based pages don't present well on phone screens, people are moving away from them.
2019 END-OF-YEAR UPDATE!!!
2019 was a good year of growth for the site with 3 new pages, updates to 8 existing pages and 61 new YouTube videos. The total number of people visiting the original text-based site in 2019 decreased slightly. I believe the cause is the mass migration of people away from traditional text-based web pages to the more entertaining videos available on YouTube. Another reason people are turning away from web pages is that commercial ventures have figured out how to work the system so they dominate Google searches. It's getting very difficult to find good information sites. YouTube, on the other hand, isn't so compromised.
The ten most popular pages of the 545 that make up the site were:
Fractile
Lichtenberg Figure Wood Burning With Electricity
How To Build The Fastest Pinewood Derby Car
Chistmas Movie Recommendations
How To Build The Simplest Electric Train
And what about the stories that started it all off? Here's how they did in 2019:
How
to Write Fan Fiction 12,878
Retief of the CDT 1,987
Dreadnought 640
Melvin Cogsworth 1,675 (This is the total for all five short stories. Individually they averaged 953 views each.)
Mirrors 356
Player 274
Dreamer 186
Devil's Food 178
Life 124
...for
a total of 18,298 people reading the stories. Over the last 22 years
479,757 people have read my stories, which isn't too bad for a guy
who's never been published.
MAJOR MILESTONE!!!
On Decmber 26, 2019, at approximately 5 AM the website got its 40,000,000 view!
By
far the most controversial page continues to be The
Most Popular Entertainer of the 20th Century. Many Elvis
Presley fans take offense that it's not him. I'm afraid that they may
be even more upset because the page titled GREATEST
MUSICAL PERFORMERS OF ALL TIME
suggests that musically not only wasn't he number one, he actually
only rates tenth place among all the performers of the 20th century.
Building and maintaining the site takes an average of two hours a day every day of the year. That's just the time to add material onto the site and doesn't include time needed to perform the many tests and experiments chronicled on it. If those were added in the average would come up to over four hours a day. Regrettably, one downside to the site's rapid growth in popularity is that I was receiving so many emails I was having to spend as much as 5 hours a day answering them. This forced me to remove my email address from all but a few pages of unique interest. I deeply regret having to do this because I truely enjoyed hearing from people and exchanging ideas about the various subjects on the site.
Using historical statistics I was able to determine THIS AND THAT got its one-millionth visitor around 3 PM on Wednesday, 9 February, 2005. It took it seven years to get to there. On February 11, 2006 at 10 PM it reached its second million in just over a year. It's amazing how fast the site is growing in popularity.
A bar chart of the daily number of visitors to the site shows several interesting patterns.

First five months of 2006
The most intriguing feature is the single day on the left of the chart on which 9,000 people logged on, almost four times the average rate of this 2008 chart. Looking into this date I discovered that the vast majority of those visitors opened the Insane Projects page, a page that typically only receives a few hundred visitors a month. I have no idea why this should happen, except perhaps that a major search engine hiccupped and temporarily listed that page very high in the rankings. There are half a dozen days with similar, though much smaller, surges in the visitor rate.
The second interesting feature is that the chart has a scalloped appearance. This is the result of weekly fluctuations in the daily visitor rate. The busiest days are Monday through Thursday with the peak usually on Wednesday. Fridays and weekends are slower.
Finally, there are several, subtle slow periods of two or three days in length. These correspond to holidays. The most notable is the three-day slump one inch in on the right hand side, which occurred during Thanksgiving.
On July 14, 2010, waynesthisandthat.com was the 41,959th most popular site out of the 87,000,000 active sites in the entire world.
I do not advertise on the site because that would compromise the impartiality I try to maintain. When I recommend a product it is because I personally found it superior. No one paid me to recommend it.
That brings the evolution of the site up to date as of the end of 2017. In size and popularity THIS AND THAT has grown to the point where I think of it more as a public service than a hobby or vehicle to promote my stories. I'm always working on additions to existing pages and creating new ones. You can find updates almost every month. In many ways the site has become a way for me to record and maintain notes on the many projects in which I get interested. I use it myself regularly to recall the details of one topic or another.
In the future expect to see many new pages. I hope you'll enjoy them and check back often.
![]()
(Click
on main site
to browse 70 other topics ranging from exotic kaleidoscope designs to
the strange world of lucid dreaming.)